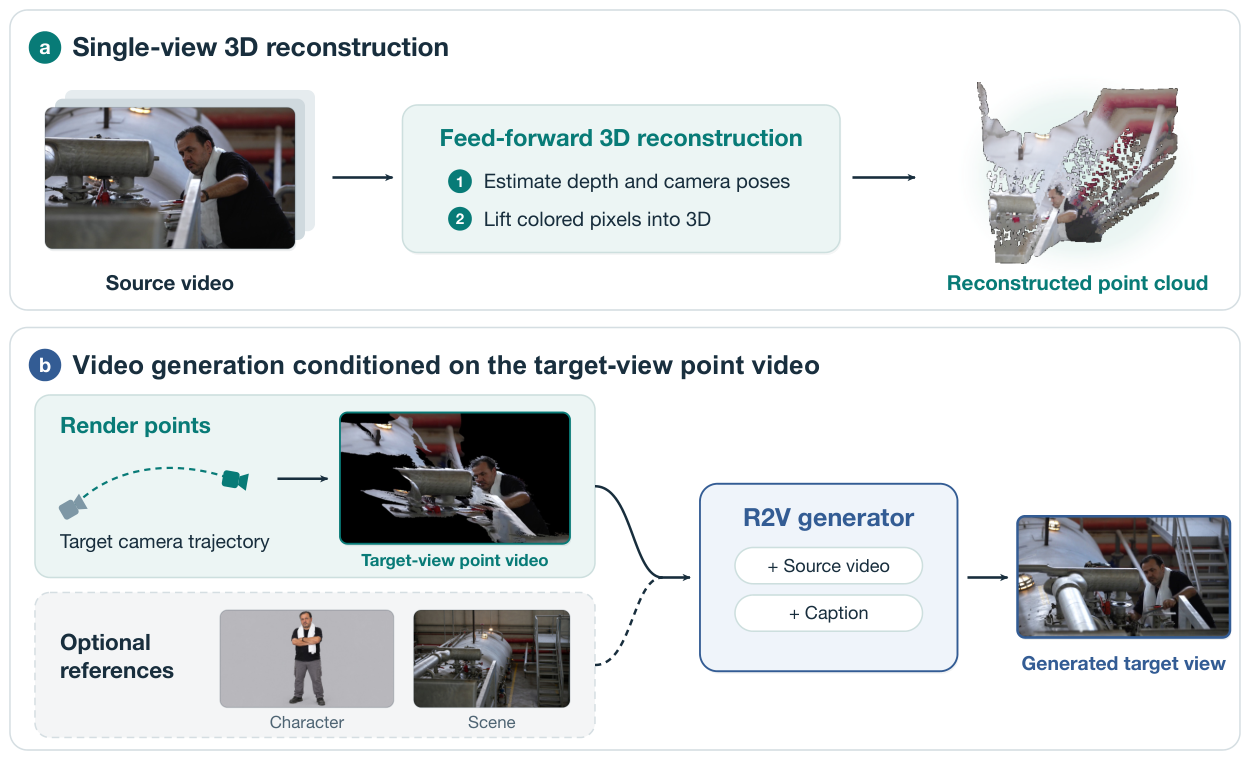
Figure 6 : Video reshooting from a single source view. (a) The system estimates per-frame depth and camera poses and lifts source pixels into a colored point cloud. (b) Rendering the points along the requested camera trajectory yields a target-view point video. The R2V generator uses this video, the source clip, a structured caption, and optional character and scene images to generate the new view.
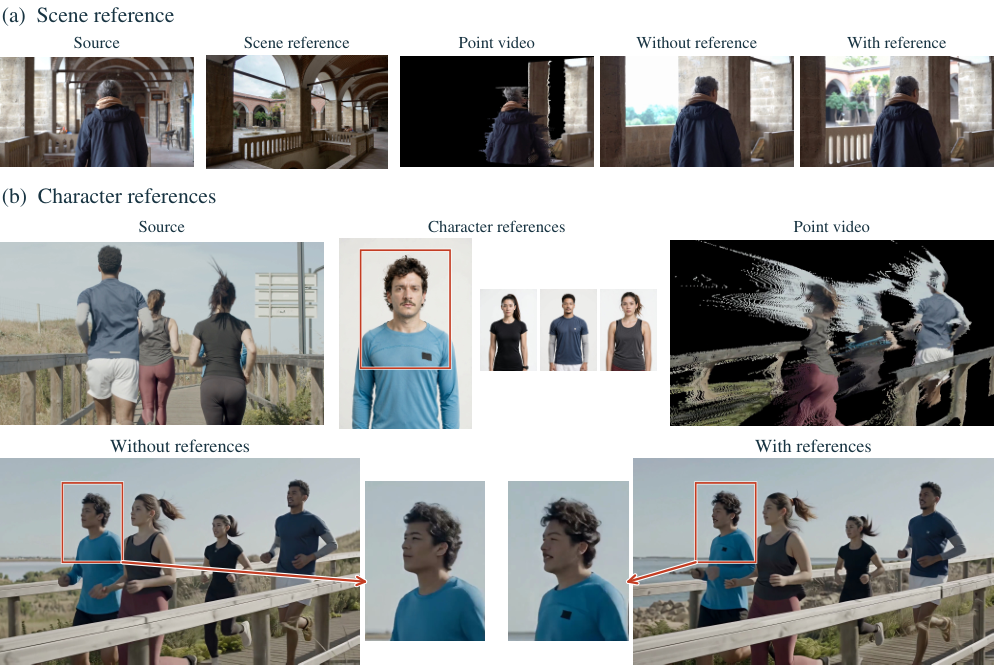
Figure 13 : Effect of reference images. (a) The scene reference supplies the appearance of the courtyard beyond the arcade. (b) The source shows the runners from behind. Boxes mark the face and upper chest of the runner in blue, in his reference portrait and in both target views. The enlargements show the shirt logo and its location relative to the collar.
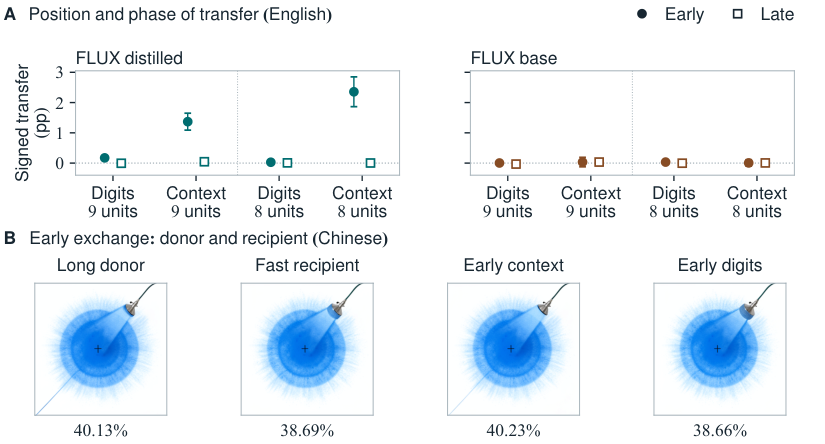
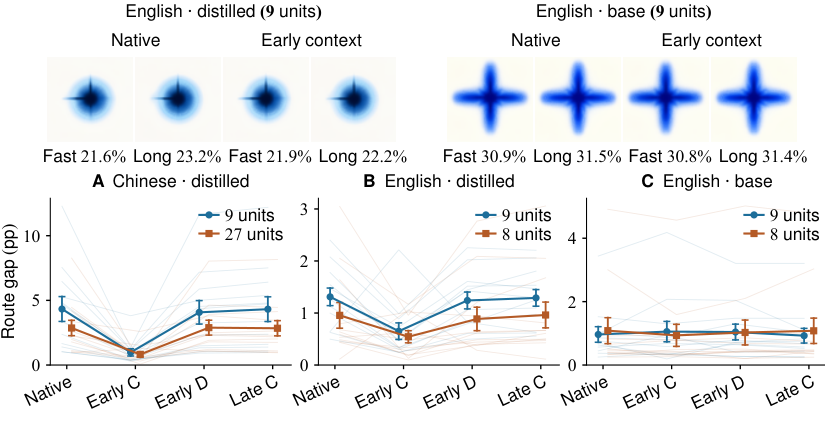
Figure 2: Position and stage localize the route difference. (A) Signed coverage transfer after norm-matched digit or context exchange. Points and bars give means and SEs. Early context carries a larger difference in distilled FLUX than in the base configuration. (B) Nine-unit routes: the long donor (1 unit/s for 9 s), fast native recipient (9 units/s for 1 s), and that recipient after early context or digit exchange. Context moves coverage toward the donor, while digits retain the recipient’s coverage. Percentages measure whole-canvas blue area in the final outputs.
Figure 3: Independent validation of the localization-derived intervention. Top: English nine-unit fast and long routes before and after early context sharing in both configurations. Percentages give whole-canvas blue area. Bottom: absolute route gaps for every layout (thin paired lines), cohort means (markers) and SEs. C and D denote context and digits. Chinese and English panels retain their respective operand combinations.
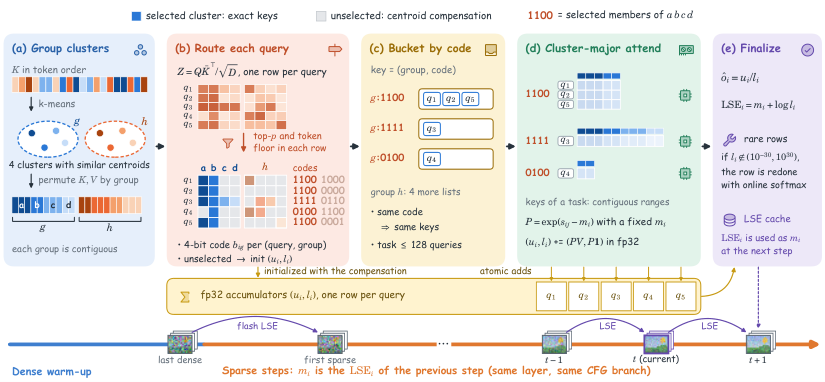
Figure 4 : Execution pipeline of PQRS for one attention head. (a) Key clusters with similar centroids are grouped and stored contiguously. (b) Each query records its selection in each group as a 4-bit code and initializes its accumulators with the compensation. (c) The queries are bucketed by (group, code). (d) Each bucket runs as dense tasks that atomically add their partial results under a fixed offset m i m_{i} . (e) The rows are normalized, and rare rows outside the safe range are recomputed. Bottom: each row’s LSE is its offset at the next step.
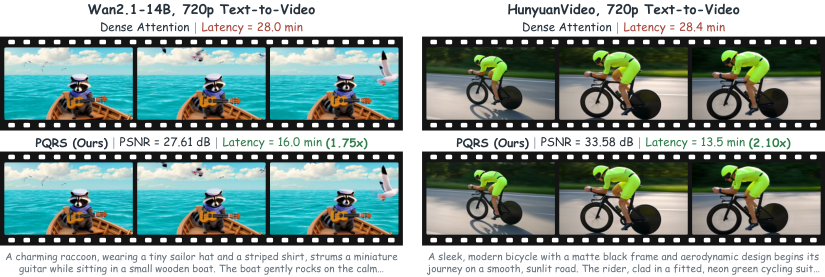
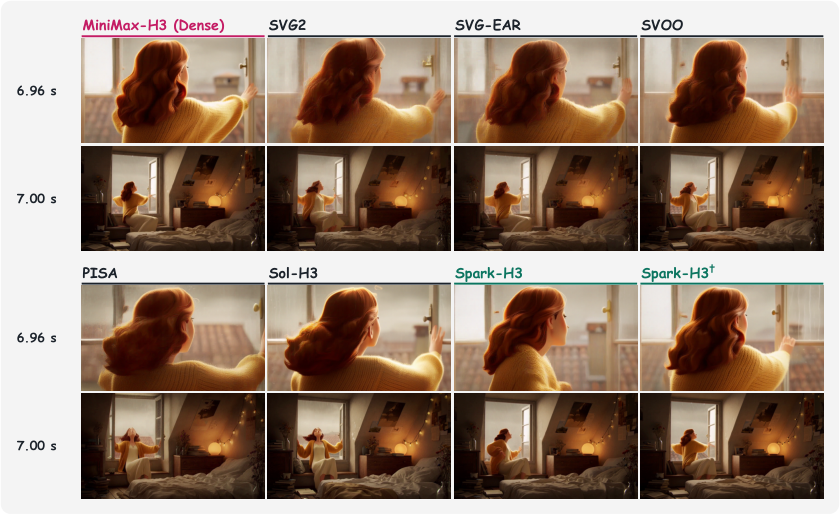
Figure 1 : PQRS accelerates 720p video generation while preserving visual quality. Each block shows frames from dense attention (top) and PQRS (bottom) generated with the same prompt and seed. On a single H100, PQRS reaches 1.75 × \times and 2.10 × \times end-to-end speedup on Wan2.1 and HunyuanVideo, with PSNRs of 27.61 and 33.58 dB on the shown samples. Prompts are truncated.
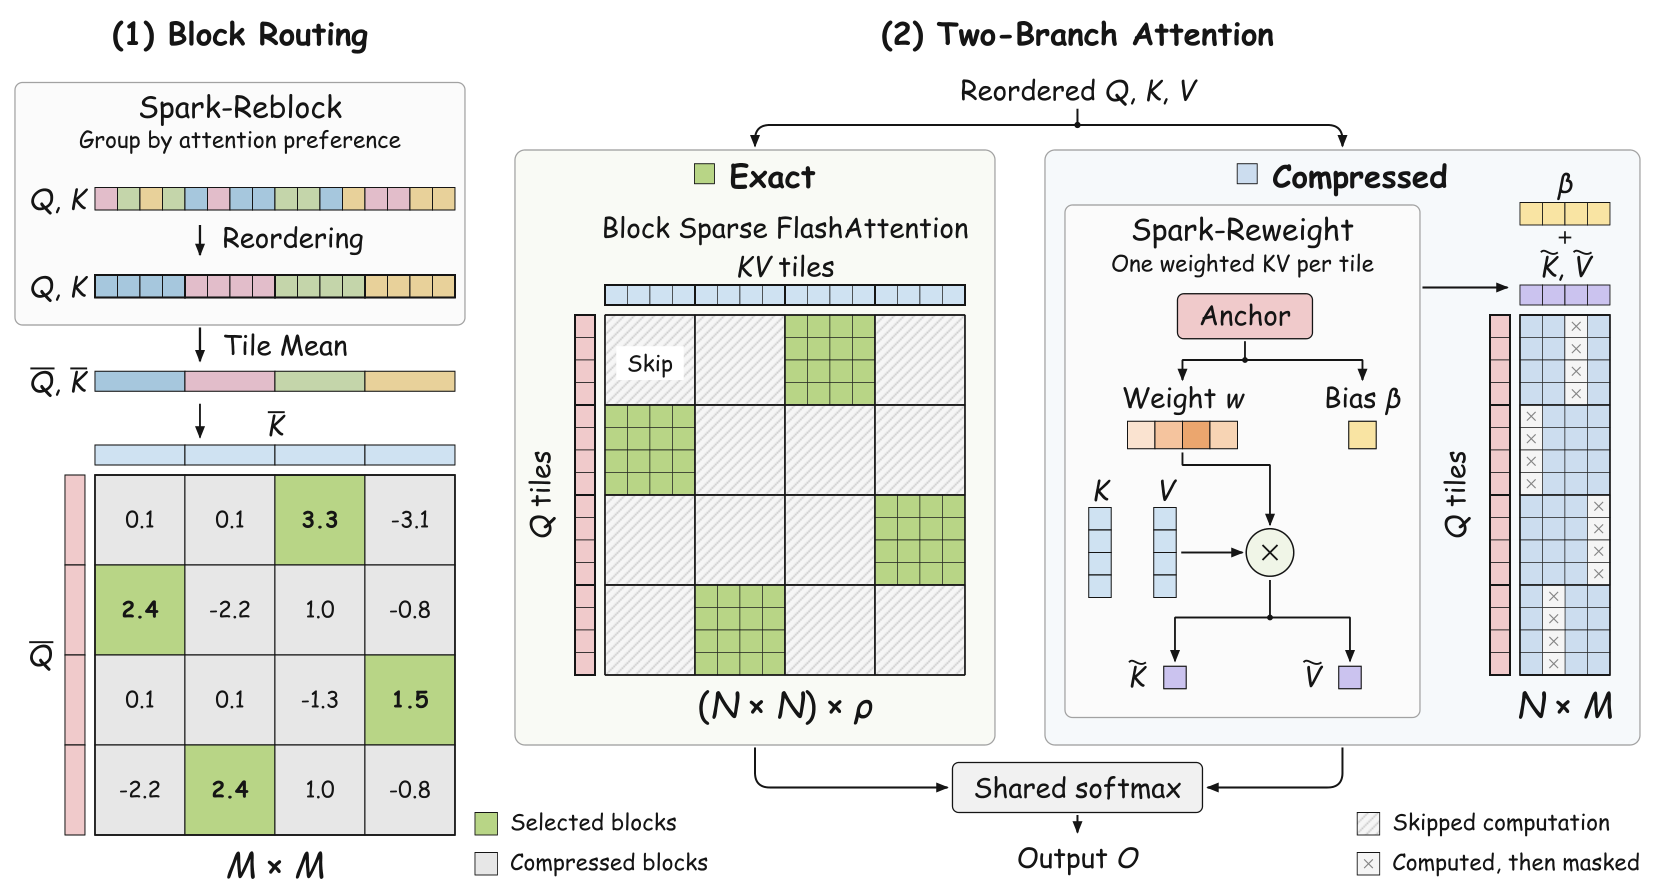
Figure 3 : Spark-Attn overview. (1) Block routing: Spark-Reblock groups query and key–value (KV) tokens into preference-aware, uniformly sized tiles; tile means guide selection of a fraction ρ \rho of KV tiles per query tile. (2) Two-branch attention: Selected blocks are computed exactly, while the rest are approximated using Spark-Reweight’s weighted KV representatives and logit biases. Both branches share one softmax normalization, with compressed entries for selected blocks masked to avoid double counting. N N , M M , and ρ \rho denote the number of video tokens, the number of KV tiles, and the exact-block density, respectively.
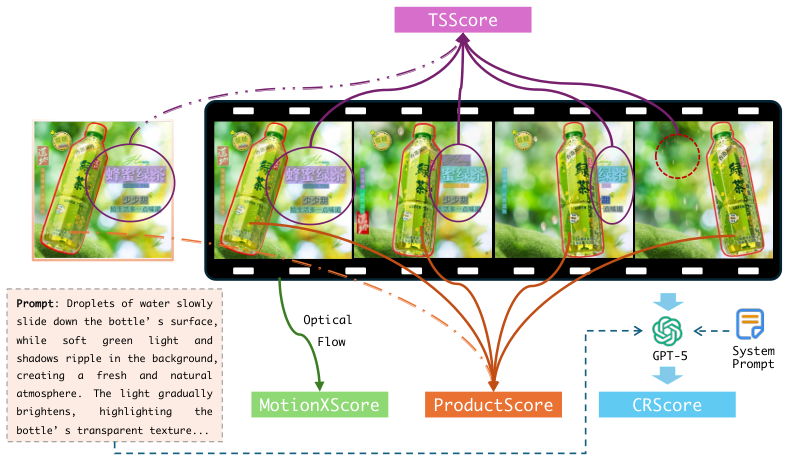
Fig. 2: Design of the four EVF-specific metrics in EVF-Bench. ProductScore compares the reference product with its generated appearance; TSScore follows rendered text across sampled frames; MotionXScore characterizes motion through optical flow; and CRScore uses the video, generation prompt, and evaluation instruction to judge creative rationality. AesScore and GmeScore provide complementary assessments of visual quality and text relevance and are not shown here.
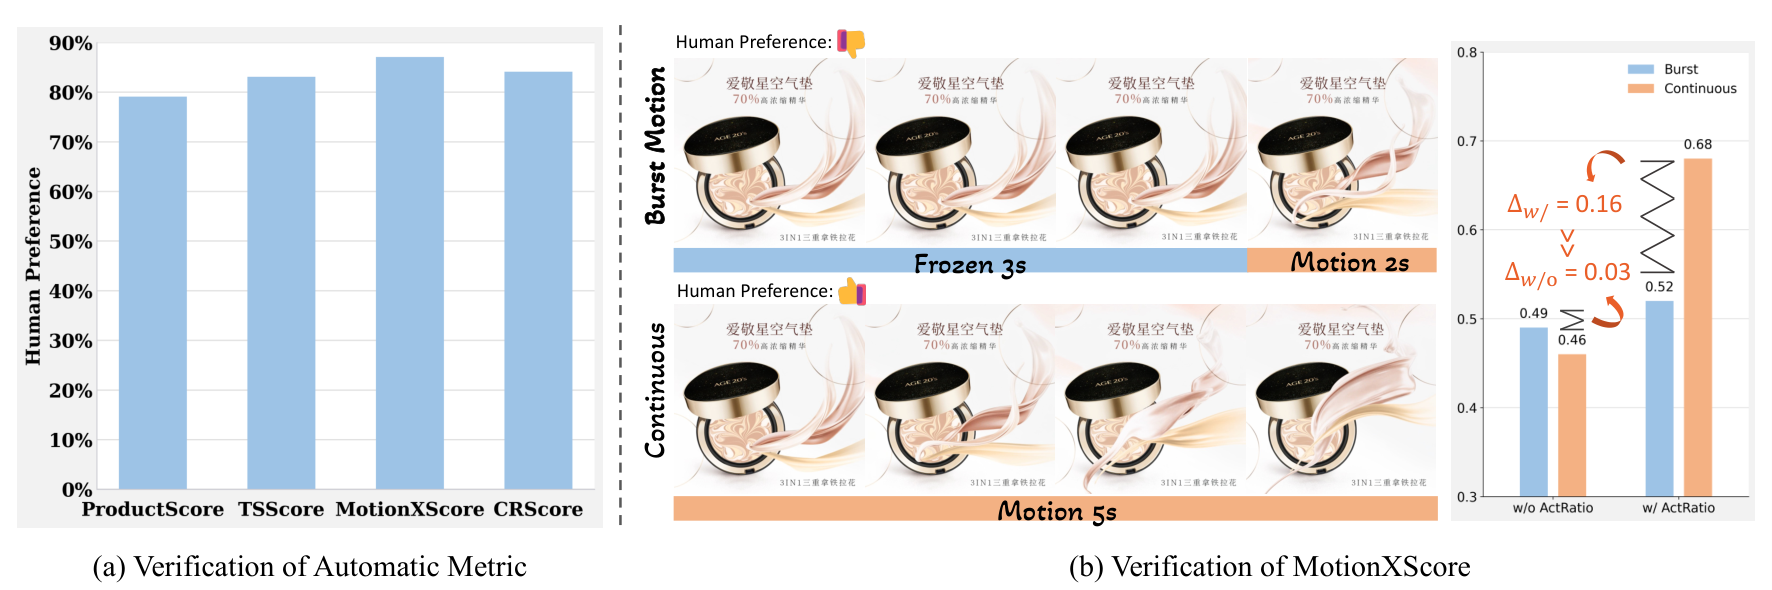
Fig. 9: Human evaluation and motion analysis. (a) Reported agreement between automatic metrics and human preferences for four EVF-specific dimensions. (b) A case comparing burst and sustained motion, with scores shown before and after adding the activation-ratio component. The illustrated human preference favors sustained motion.
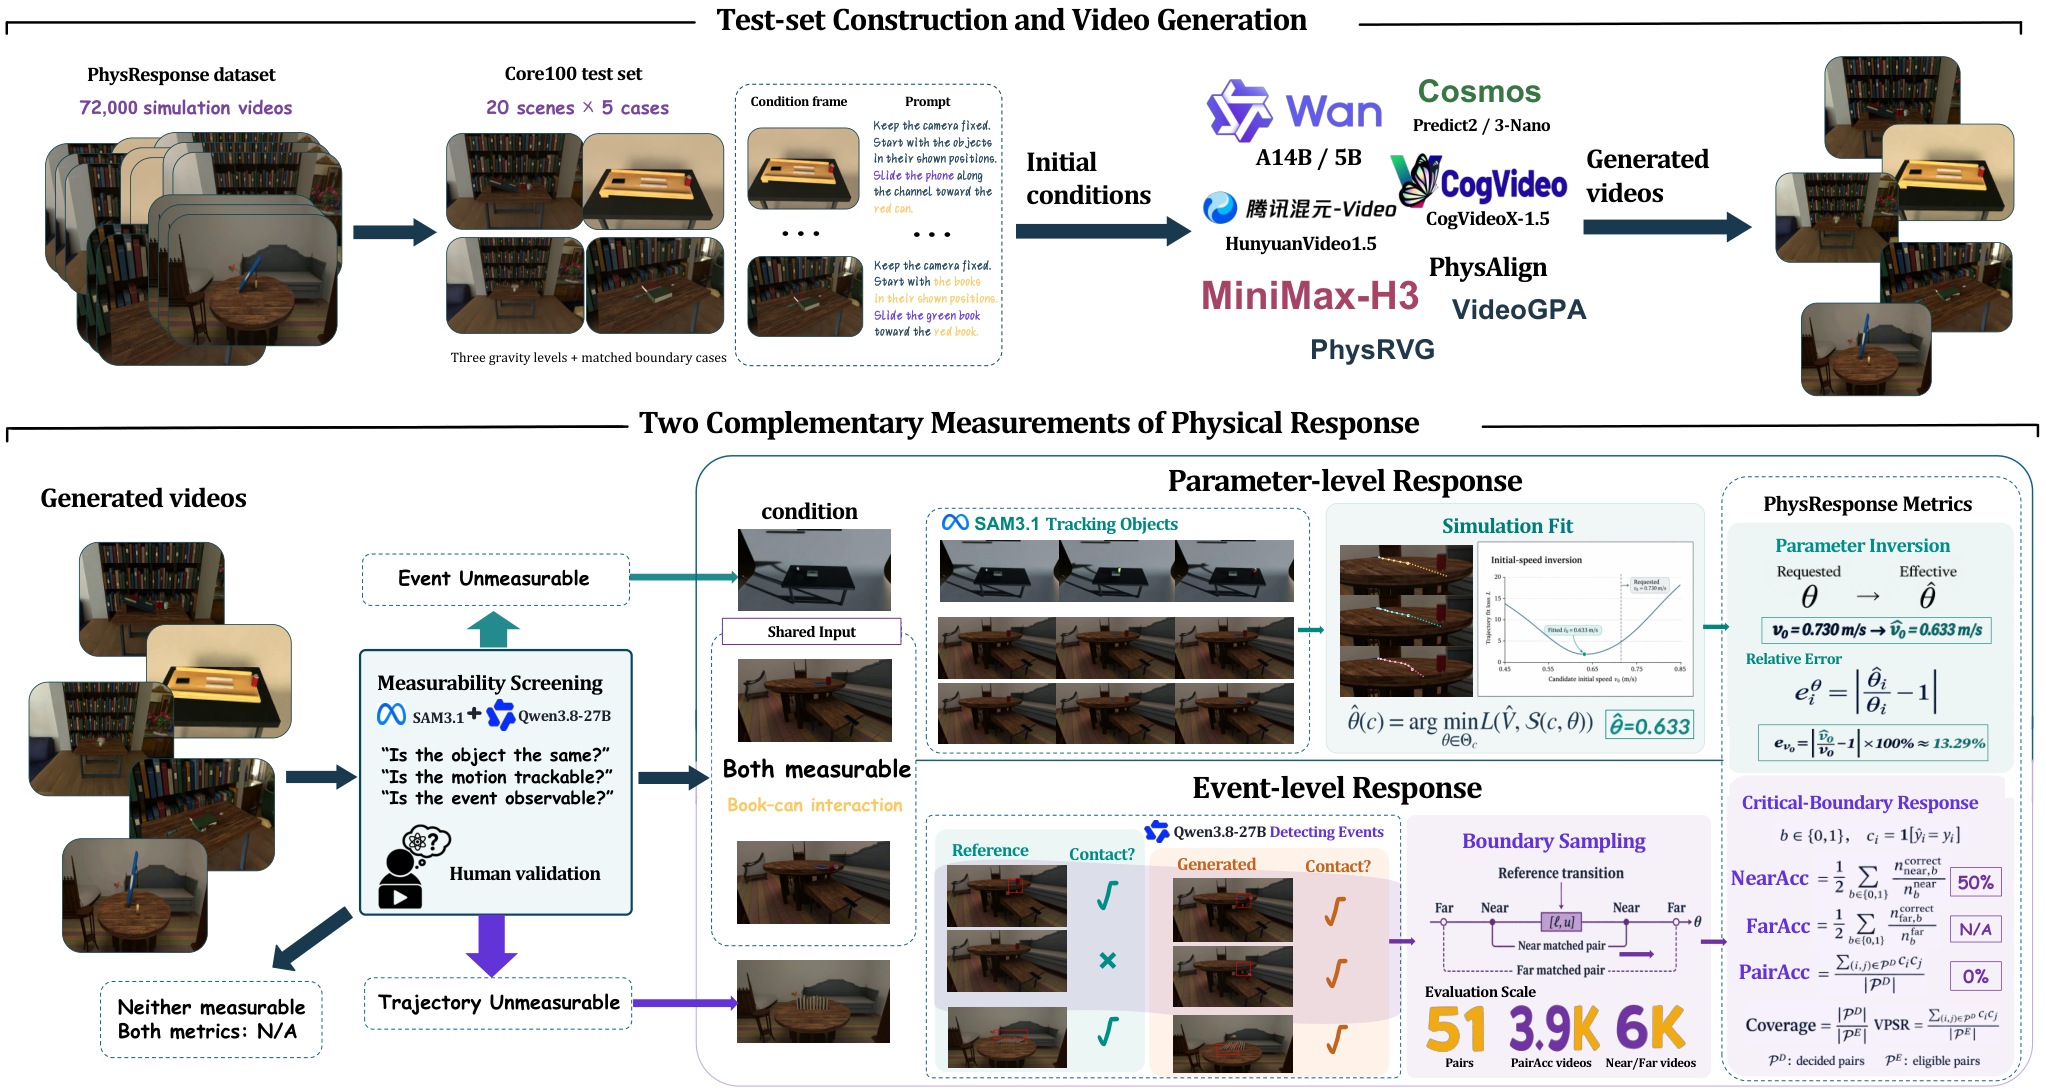
Figure 5 : PhysResponse evaluation overview. Core100 conditions and prompts produce videos for two complementary measurements. Object tracks support simulator-based parameter recovery; reference transitions and visual event observations support NearAcc, FarAcc and PairAcc. Measurability screening identifies the evidence available to each branch, with human validation of the observations.
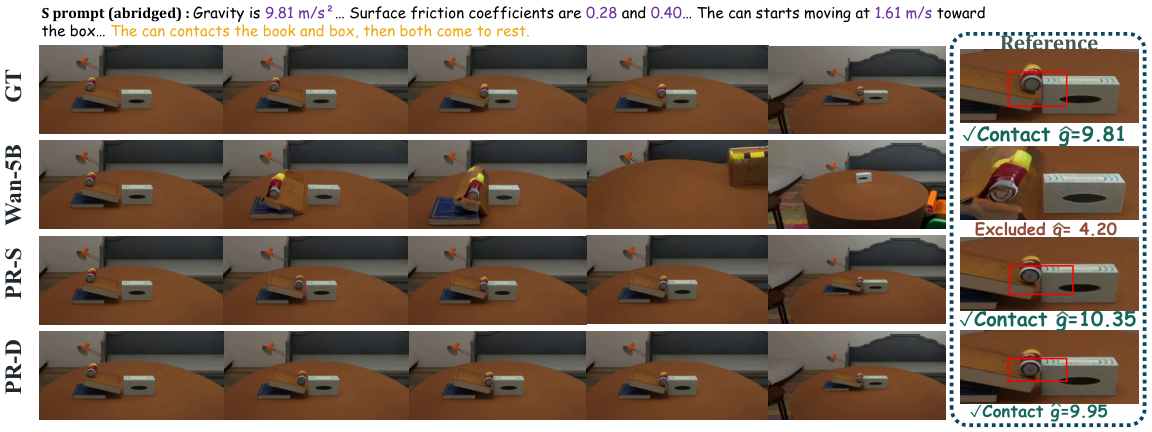
Figure 7 : Matched fine-tuning example. T17_C03, Standard prompt: GT, Wan2.2-TI2V-5B, PR-S and PR-D. Right insets show fitted gravity and contact outcomes; the Wan2.2-TI2V-5B result is marked as excluded.
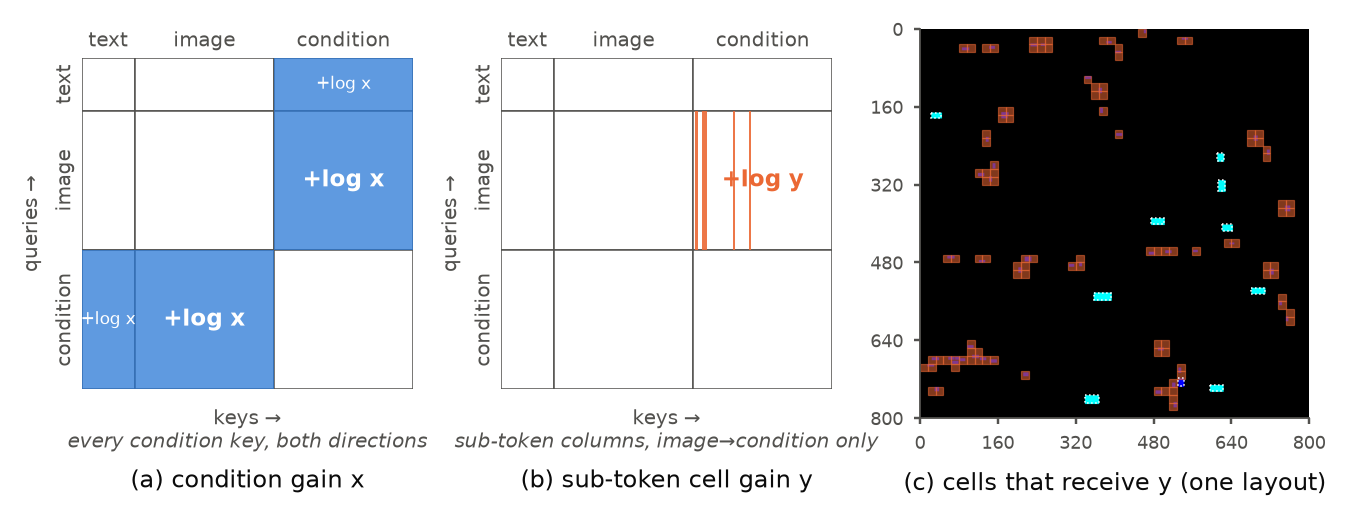
Figure 3 : Two attention gains as edits to the joint attention mask [ text , | , image , | , condition ] [\text{text},|,\text{image},|,\text{condition}] . (a) Condition gain: add log x \log x to all condition keys for image/text queries, and symmetrically to image/text keys for condition queries. (b) Sub-token-cell gain: add log y \log y to the columns of cells holding a box smaller than a token cell, for image queries only. (c) Cells receiving y y in one benchmark layout (orange), over the layout mask; boxes at or above cell size (white outline) get no gain.
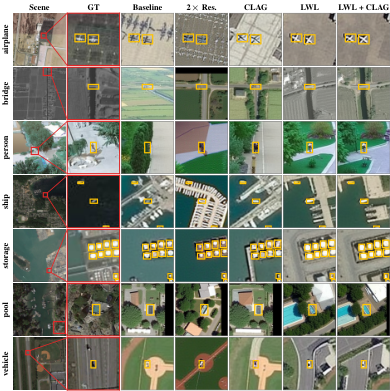
Figure 5 : Qualitative comparison on benchmark layouts. Magnified crops highlight the target tiny objects (yellow boxes). Our CLAG and Layout-Weighted Loss (LWL) improve tiny-object fidelity over the baseline and 2 × 2\times inference resolution, with their combination producing the most consistent results.
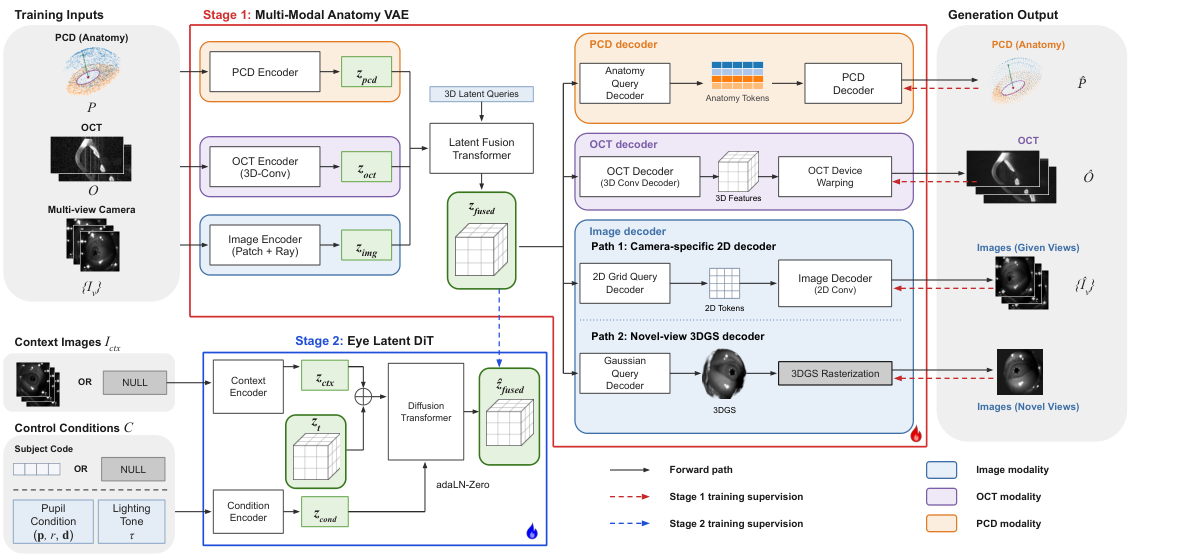
Figure 2: Overview of EyeDiT. (Stage 1) Our multi-modal anatomy VAE learns a shared latent space from OCT volumes, near-eye images and anatomy point clouds. (Stage 2) Our eye latent DiT is then trained on this latent space to simulate various gaze, pupil, and identity conditions. Our pipeline generates multi-modal outputs for a learned identity or for a new subject given by a context image.
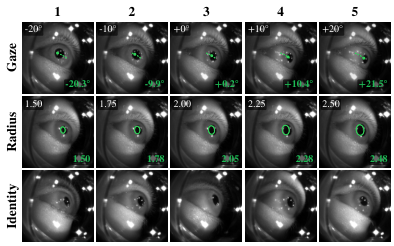
Figure 4: Generation results when changing the gaze, the pupil radius and the identity embedding, respectively (rows), in five steps (columns). Only the changed factor varies along each row, and the generated pupil follows the commanded values. The green lines and circles mark the commanded optical axis and pupil radius. Top-left: commanded value. Bottom-right: readout value.
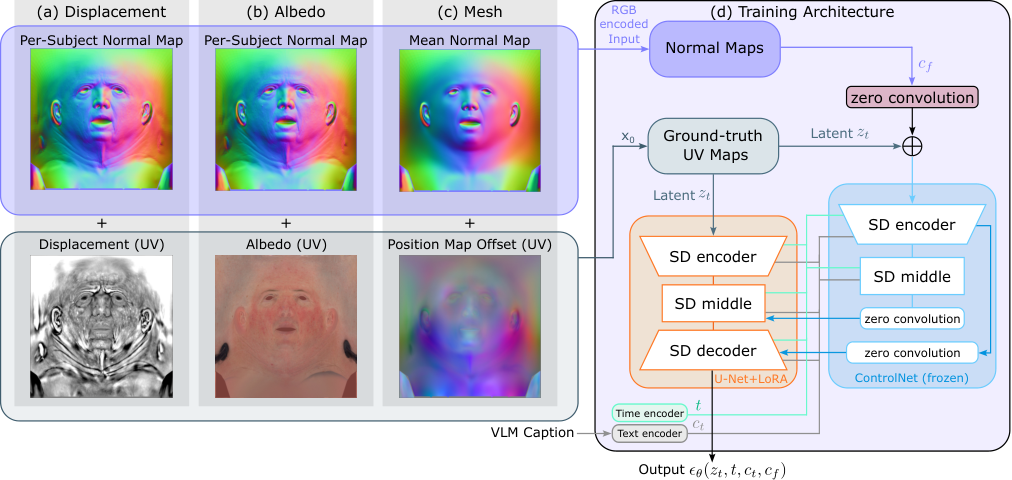
Figure 3 . FaceRiff pipeline overview. (a–c) Task-specific LoRA adapters synthesize displacement, albedo, and mesh UV maps from a VLM caption and normal conditioning. Displacement and albedo use per-subject normals N N , while mesh generation uses the dataset-mean normal N ¯ \bar{N} as a canonical scaffold. (d) The ground-truth UV map is encoded as z 0 z_{0} , noised to z t z_{t} , and denoised by SDXL to predict ϵ θ ( z t , t , c t , c f ) \epsilon_{\theta}(z_{t},t,c_{t},c_{f}) . A frozen Normal ControlNet provides normal conditioning c f c_{f} , while task-specific LoRA weights adapt SDXL for each modality.
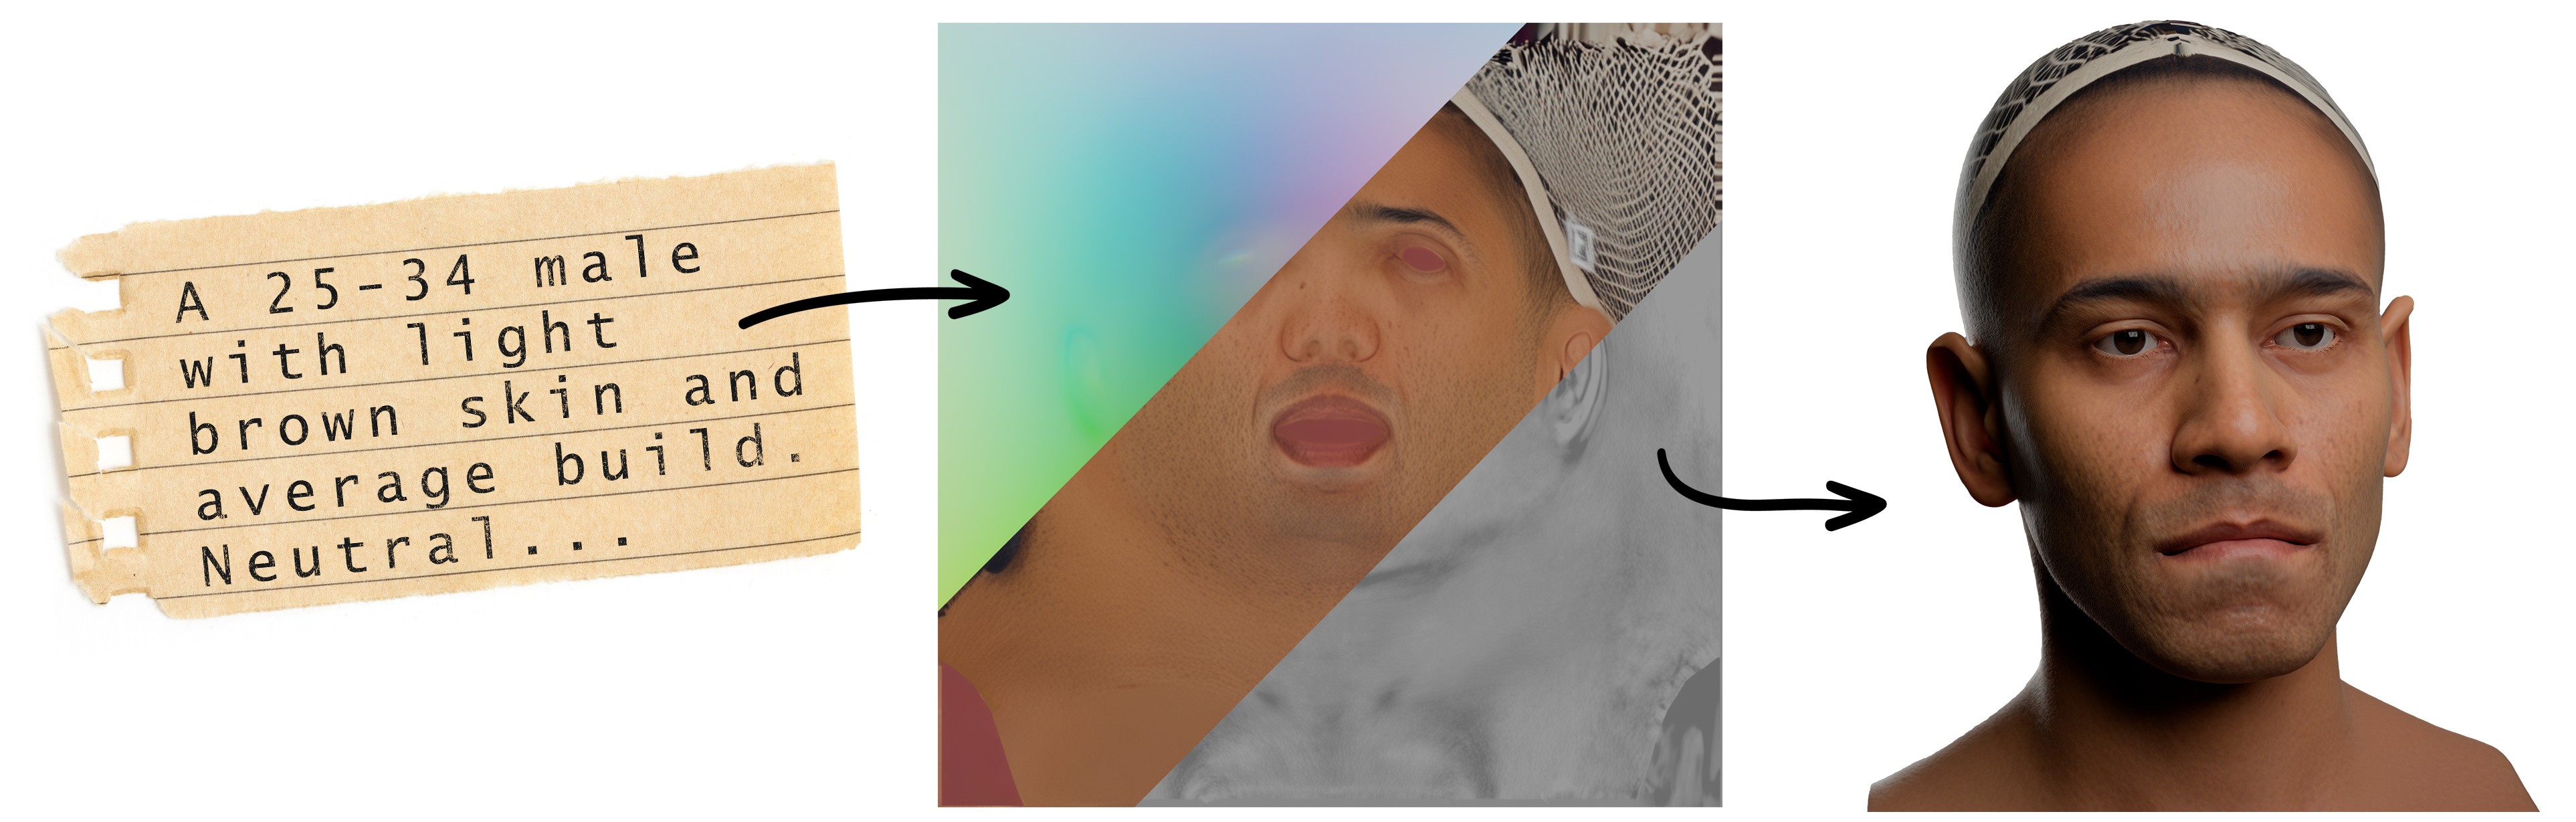
Figure 1 . FaceRiff: text-driven 3D face asset generation. From a text prompt, FaceRiff synthesizes mesh, lighting-independent albedo, and pore-scale displacement in a shared UV space in a feed-forward manner, combining them into the final rendered full head. Teaser figure showing a text prompt alongside the generated 3D face assets—mesh, albedo, displacement—and the final rendered head, produced feed-forward by FaceRiff.
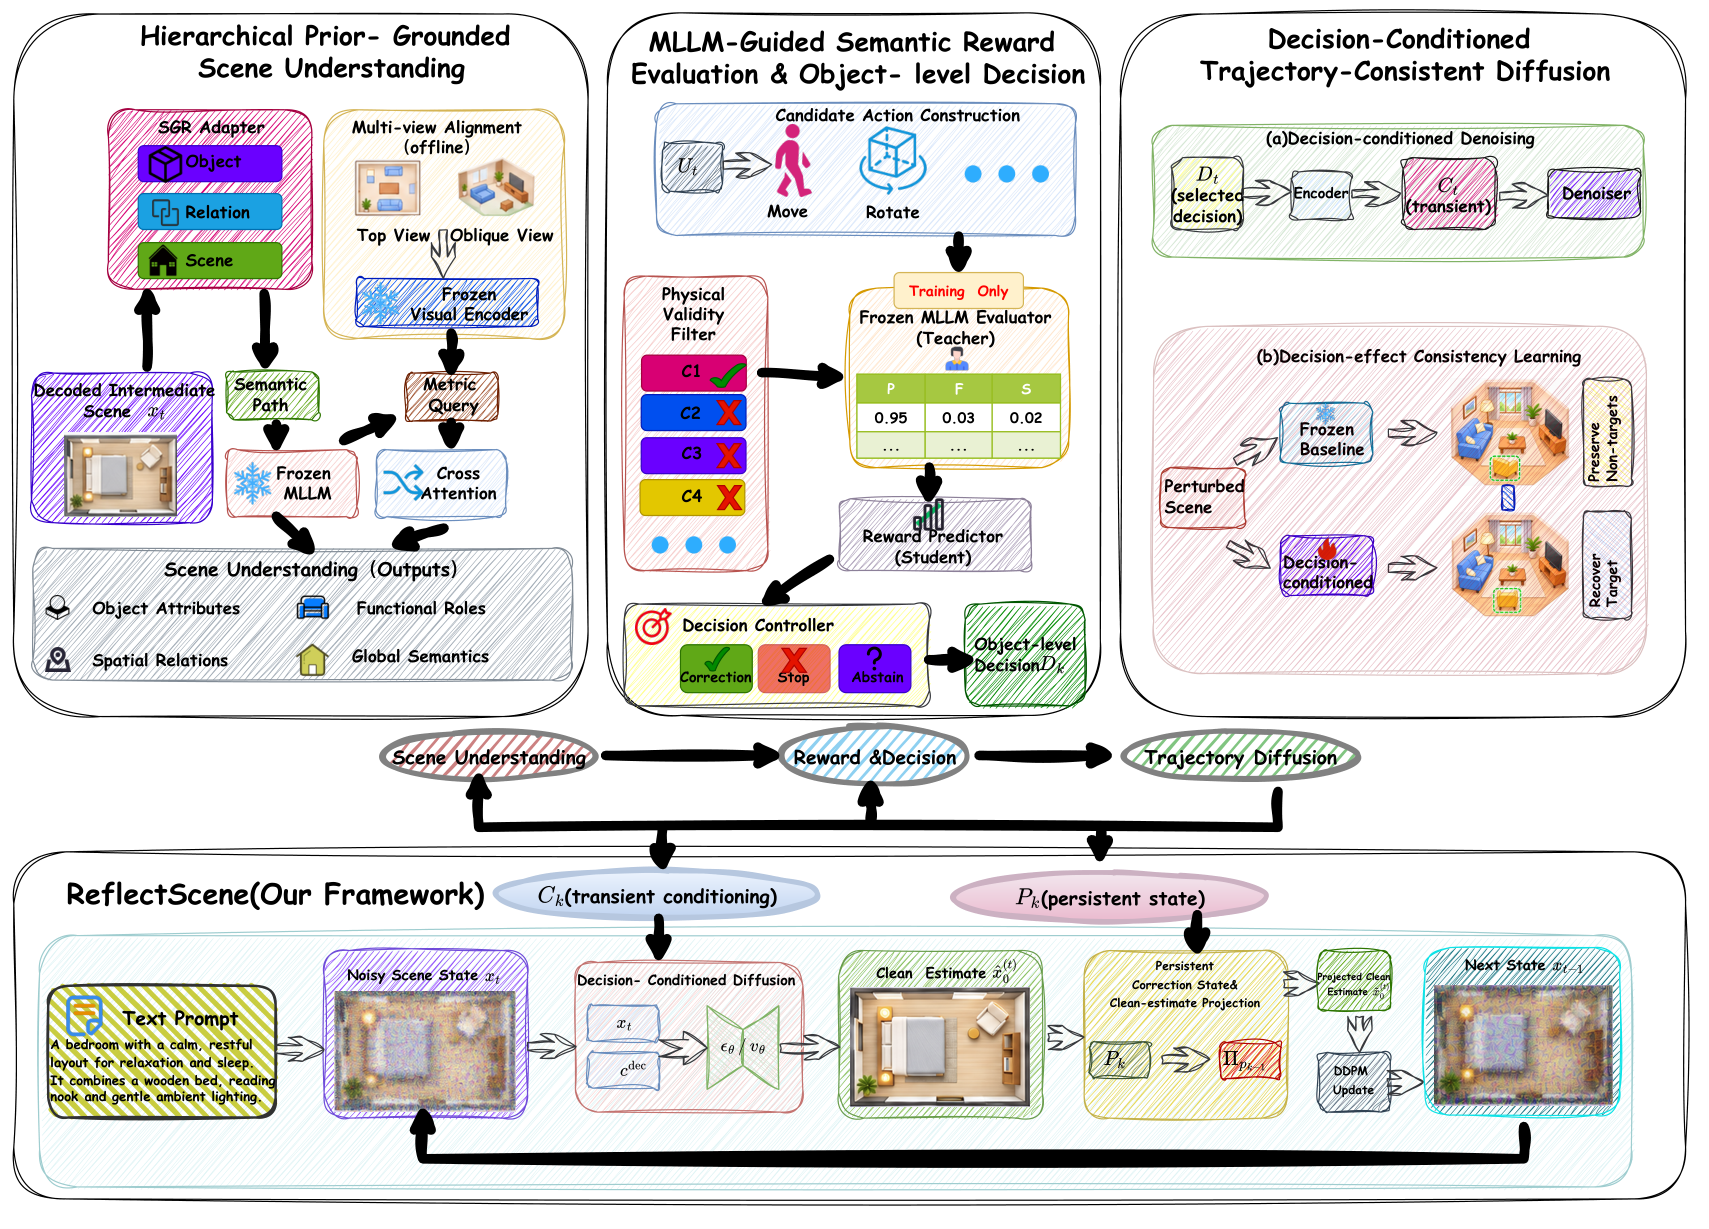
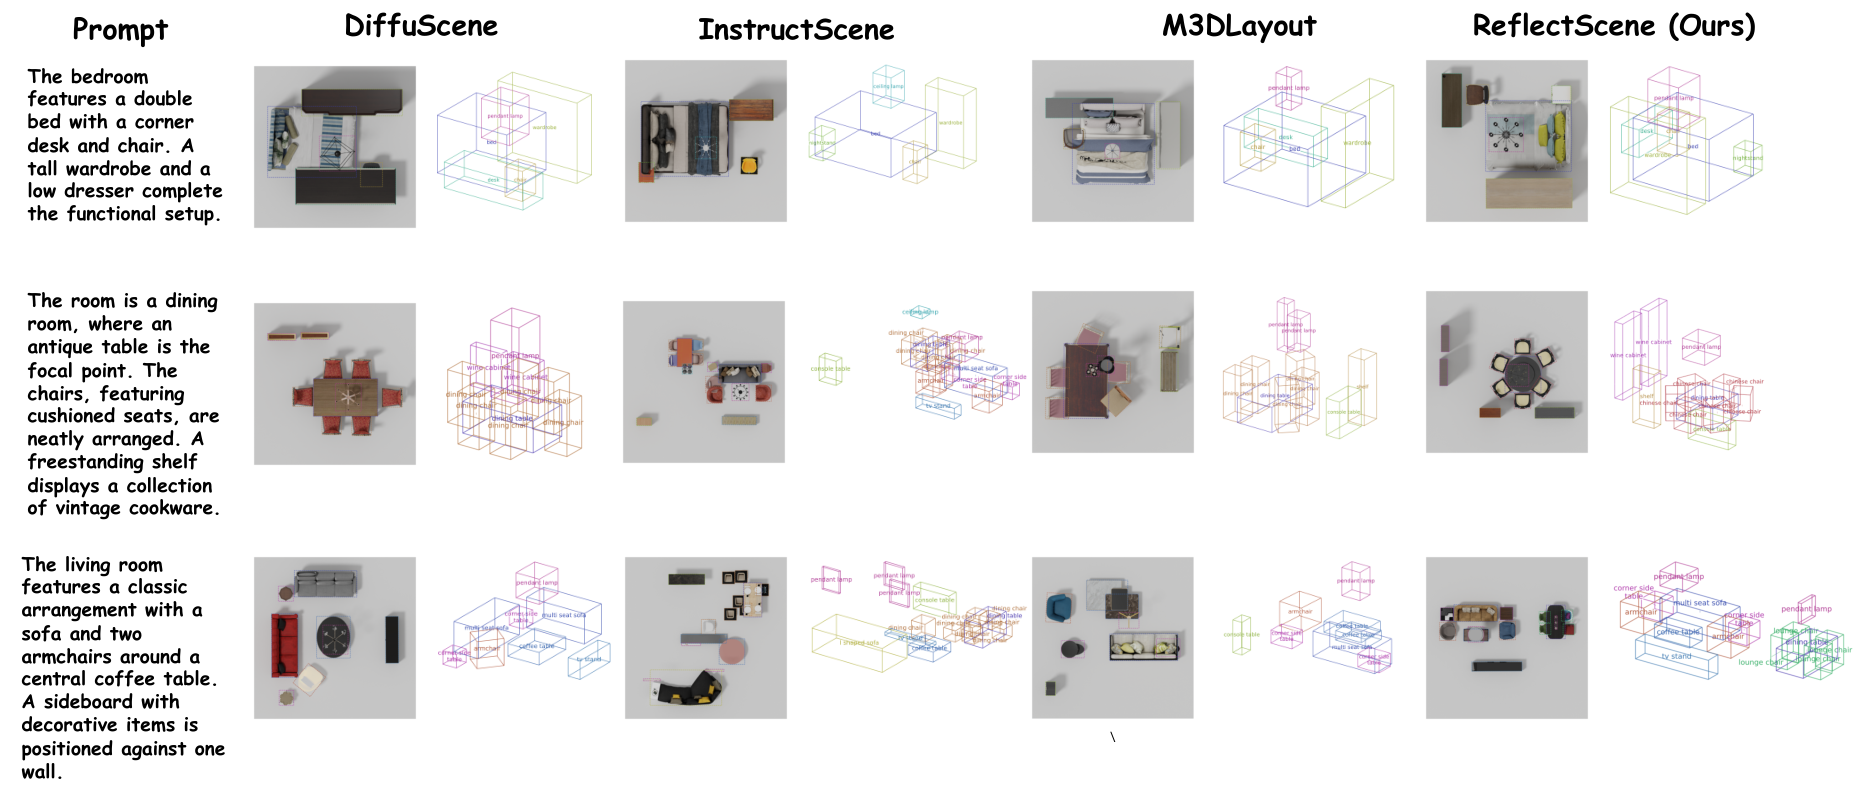
Figure 2 : Overview of ReflectScene. ReflectScene integrates hierarchical scene understanding and MLLM-guided decisions into object-centric diffusion. At each denoising step, intermediate clean estimates are assessed to select object-level actions, providing transient conditioning, while buffered non-STOP actions are executed every 50 steps to update a persistent correction state. This state is projected onto subsequent clean estimates before DDPM posterior sampling, with decision-effect consistency learning promoting target recovery and non-target preservation.





评论 (0)